

2.2 Roadmaps and OKRs
2.2 Roadmaps and OKRs
We have to empirically measure progress toward success. "Features delivered" is old hat. Create customer-facing value every single time by knowing what to measure and how to keep measuring.

Writing this chapter is a little challenging. Even intimidating. I needed to find a way to turn something that’s a bit bothersome, even tedious, into something meaningful and hopefully engaging. Because it’s emphatically important — yes, I know I’ve said that about a lot of these early-stage activities. The success of your project hinges on establishing a solid foundation. So here goes. Let me know how I did in the comments.
Introduction
This chapter is about measuring success. Specifically, it’s about turning the objectives you’ve chosen for your project into action that can be measured. The bit about measuring is particularly important because if you can’t measure well, it’s inevitable your project will fail to some extent or another.
That’s why this chapter is so important. If we don’t set ourselves up now for success, we will not succeed.
Picture this: You’ve agreed on an overall strategy for your project. The business objective is to lower operational cost. There’s a second objective to lower customer cost as well. The reasoning is, you’ll do so by passing on operational savings to your customers. As a strategic goal this is excellent but without a system in place to execute the idea nobody will know where start. Likewise, without agreement of how to measure success (and exactly what “success” looks like), there’s no way to know when or if you achieve significant results.
There are two paths forward: Without measuring, and with measuring. Let’s explore these scenarios.
Without measuring
We introduced some objectives. Let’s state them a little more clearly:
Lower operational cost by reducing poorly utilized infrastructure and improving the application operational characteristics.
Reduce the product price for customers by passing on those savings.
From here, you might choose to launch directly into implementation. There may be obvious places to cut costs — perhaps consolidating some server infrastructure, turning off unused or under-capacity systems. That’s probably the low hanging fruit, relatively easy to identify and implement. But we can go further. Perhaps the next step is to terminate an expensive Oracle database license in favor of an open source solution like Postgres. That’s going to take more effort, but thanks to Postgres’ relatively high level of Oracle compatibility it might not be too difficult. Beyond that, you can embark on some serious application rearchitecture and migrate to a highly distributed, scalable model — possibly embracing CQRS and actor sharding along the way, squeezing every little bit of distributed power out of a small cluster of server nodes. That, of course, is a lot more work.
Depending on your affinity for this kind of work, it can be exciting! A whole new architecture using the latest, forward thinking in distributed systems. Pretty neat. Also potentially expensive to build.
So what happens when leadership cracks down, demanding to know why your engineering project is spending more money than it’s saving? When they ask why important features are being delayed for this “cost reduction” project — one that isn’t actually generating the kinds of cost savings originally envisioned?
With measuring
There’s a better approach, one that establishes clear and specific outcomes and measures progress toward those outcomes. The goal is to make sure your objectives are achievable, that the team stays tightly on-track toward those goals, and at the end of the project you’re in a position to say “mission accomplished.” Or better, “mission exceeded.”
That’s what this chapter is all about. It’s the difference between declaring victory every time versus having fuzzy, unclear goals that miss the mark in unexpected and sometimes very disappointing ways.
That’s where roadmaps and OKRs, or objectives and key results, come into the picture.
What are OKRs (objectives and key results)?
Stated simply, OKRs are a framework you can use to define, coordinate, and accomplish goals in a demonstrable way. “In a demonstrable way” is the differentiator here. OKRs will set us up to empirically know that we are on track, allow us to course-correct if we get off track, and give us the ability to declare “mission accomplished” with cold, hard facts.
Here’s a simple definition for OKRs, courtesy of Forbes:1
Objectives are specific and clearly defined goals that will have a major impact on the business. They should be challenging but attainable, and align with an organization’s strategic goals.
Key results are how an objective’s progress is measured or monitored on the path to achieving the goal. Key results serve as outcomes that provide evidence of whether a goal has been reached or an objective has been accomplished.
We might write an OKR like this:
We will reduce our operational cost by 30% as measured by the month-over-month spend of our AWS infrastructure.
A very little history
According to Forbes, the methodology for OKRs was developed in the 1970s by Andrew Grove, Intel’s CEO. Grove taught one of the company’s most successful salespeople, John Doerr, about the concept. Later, Doerr served on the board of Google, introducing its founders, Larry Page and Sergey Brin, to OKRs. In 1999 Google implemented OKRs as a business practice and has used them ever since to great effect.
In the previous section 2.1, Product strategy, we established our business objectives. These are what we’ll be working with. Your business objectives may already be clearly stated goals — or, they may need a little refining. That’s fine, this is our opportunity to make sure every objective has a measurable outcome.
Conceptually this is pretty simple — just establish measurable outcomes for clear goals. But, there’s a hard part too: Deciding exactly what to measure and then ensuring we never lose sight of those measurements or stop measuring.
What to measure
Sometimes it’s hard to figure out exactly what to measure. In our example, we set the business goals on reducing cost of infrastructure. That leads to a nearly obvious, measurable goal of cutting our month-over-month cost. Easy peasy, as the saying goes.
But what about more nuanced situations? For instance:
How do you measure how quickly the team gets new features from concept into the customer’s hands?
Can you measure regulatory compliance?
Is it possible to measure an increase in revenue as a leading indicator, distilling measurable metrics at the development phase?
What about measuring customer satisfaction in a meaningful, clear, fact-driven way?
In my experience, everything can be measured with metrics you can test. Sometimes it’s easy to figure out what those metrics are — and sometimes it takes a bit of brain power, collaboration, and agreement on what “moving the needle” actually looks like. That’s where having a system that models your return on investment is crucial. It’s not acceptable to make simple assumptions, like, “if there are more users, they must be happier users.”
One tool I’ve applied in nearly every single situation is a mapping framework that distills business objectives to straight up revenue earned. I know this can sound a bit cold and capitalistic, but it’s the reality: Businesses operate by staying in business. Even non-profit businesses must make positive revenue or they will go out of business. Because of this, everything comes down to dollars — even, “let’s improve our customer experience.” That objective turns into happier customers that stick around longer, ultimately generating a positive impact on revenue.
So unless you are literally working for a philanthropic enterprise with the objective of giving away all of its money, this approach works. (And in that case, you can still connect outcomes to dollars — just the negative flow of dollars, not positive).
It can be helpful to have a map handy. The following is a map that traces most business objectives (such as improving cost efficiency) to specific strategies (such as avoiding cost), along with a definition of what that might look like:
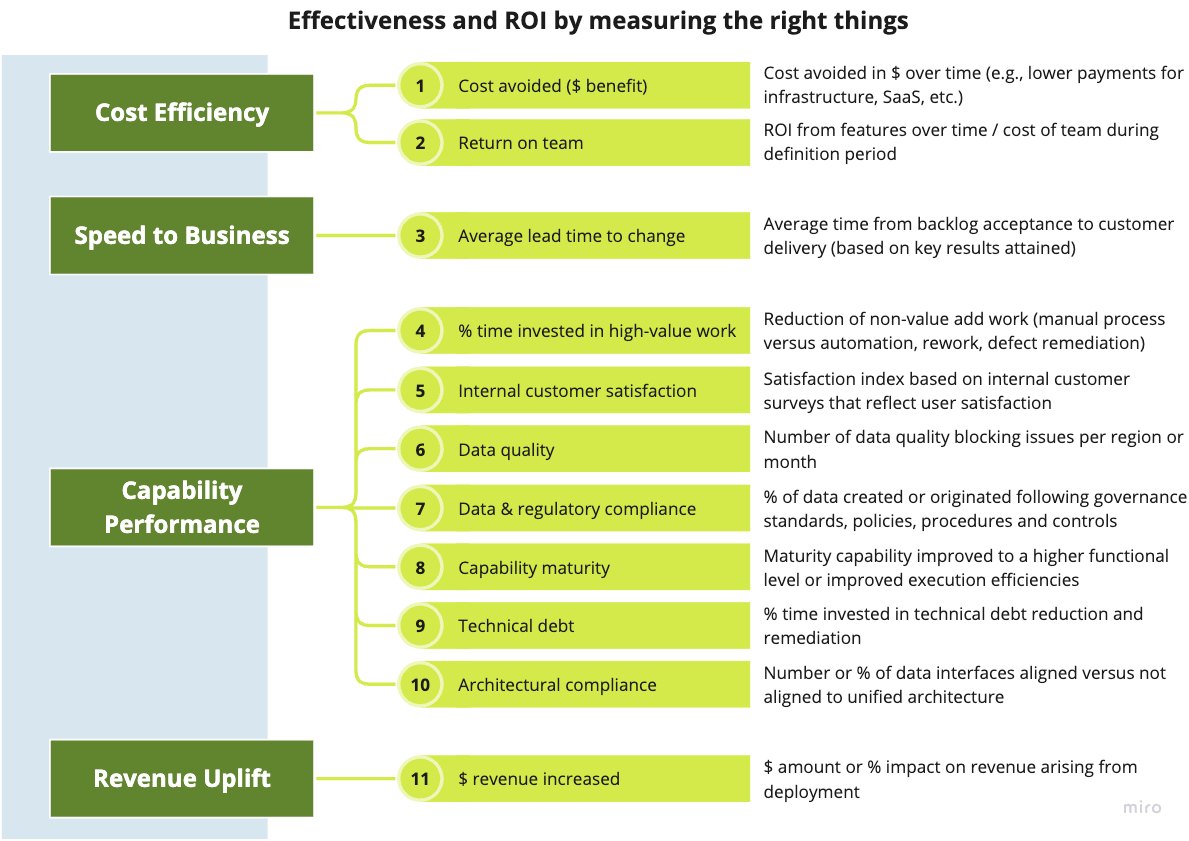
Using a map like this can be quite helpful — it reminds us of how we can translate those high level business goals into tangible, measurable metrics that can be instrumented and monitored.
Never lose the “line of sight”
Another tricky part is making sure those original goals are always on everyone’s mind. I like to think of it this way: If I were to ask any engineer on the project, at any time, “why are you working on that?,” they would know:
Exactly how their work is going to affect key results,
Furthermore, they would know exactly how important their work is toward that goal, and be confident that there’s nothing more important they could be working on,
Finally, they would know exactly how value is going to be proven using simple, fact-based testing.
This awareness and confidence provides a line of sight from any point in the project back to the original business objectives and the value those objectives create.
The trick here is to create multiple checkpoints and feedback loops. That’s what the playbook does. In the following diagram you can see how major milestones and activities in the playbook constantly checkpoint your key results. We protect customer value by continuously re-injecting those key results into the delivery pipeline and insisting that the only path forward is a positive measure of outcomes.
If you use the referral button below, you’ll earn free premium access to Customer Obsessed Engineering. Just three referrals will earn a free month!
Keep reading with a 7-day free trial
Subscribe to Customer Obsessed Engineering to keep reading this post and get 7 days of free access to the full post archives.