
Part 3: Refining our data pipeline architecture to solve a few hidden challenges
Ensuring scalability, reliability and responsiveness pose interesting problems in distributed architecture. Here’s how to build a forward-looking foundation.

In this third article on data pipelines, we’ll firm up our architecture before coding. We’ll make sure all of our requirements have been adequately addressed (there are still a few missing pieces). We’ll also review our design to make sure all goals have been met. The finished architecture needs to provide a responsive, scalable and reliable foundation.
In the previous article I introduced a foundational architecture for our data pipeline, checking off several of our requirements. Here’s a quick recap:
We leveraged an internal cache for isolation to break our dependency on external data sources, improving our resiliency and scalability options.
We introduced the idea of an asynchronous message architecture, so we aren’t bound by lengthy, sequential processes.
We keep our annotations long-term with internal persistence so we don’t reprocess data when unnecessarily.
Source data as treated as an immutable source, thus protecting our data integrity.
Our visualization layer is responsive, running off our internal cache so that it’s independent from other components.
Here’s a sketch of the architecture as it stands now:
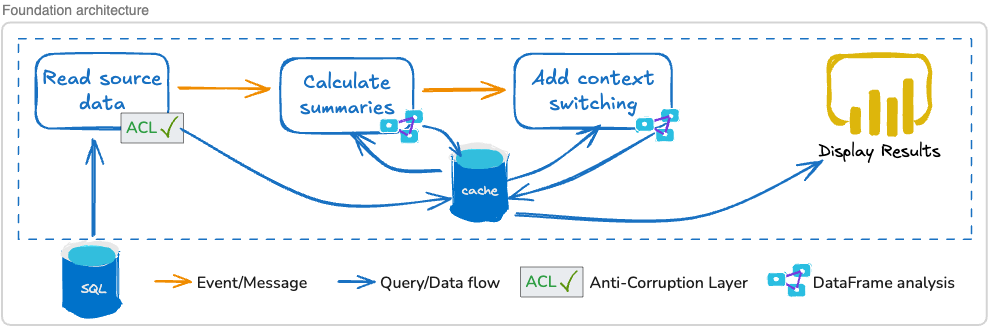
It’s a good start, but we aren’t finished.
There are still two requirements that don’t have a clear solution:
We want to be able to reprocess data, effectively “rewinding history” and applying new analytics. For instance, if we add a new analysis and insight to our pipeline, how are we going to go back and view that new analysis on old data?
Finally, we want to be able to model our insights — that is, visualize it in a presentation layer. But we haven’t talked about how that’s going to happen.
Once we tackle those last few requirements, we’ll fill in some details — such as, deciding on a cache technology to use. We’ll also take an end-to-end look at what we’ve designed to see if we missed something important.
If you’re new, welcome to Customer Obsessed Engineering! Every week I publish a new article, direct to your mailbox if you’re a subscriber. As a free subscriber you can read about half of every article, plus all of my free articles.
Anytime you’d like to read more, you can upgrade to a paid subscription.
Finishing our foundation
One of the most powerful and underused capabilities in data analytics is the ability to reprocess historical data with new logic. When you fix a bug in your analysis or refine a calculation, you often want to know: “what would the last three months have looked like with this new logic?”
Fortunately, our design thus far aligns pretty well with this goal.
Essentially, all we are saying we need to do is throw out information that is no longer accurate and then reprocess the source data and rebuild a new and improved picture of the world. We might do this for a couple of reasons:
We changed our analytics. Consequently, we need to throw out all of our old findings and recalculate our insights.
The source data changed. Perhaps there was a historical data update, invalidating our findings. Again, we want to throw out our findings and reprocess.
Looking at the problem from that perspective, the architectural answer is simple: we need a way to delete our annotations.
Once we wipe our annotations, we’ll need to make sure they are recalculated. There are different strategies we could use, but for the most part our options are:
Rebuild our annotations on-demand. This is fine if we’re OK with a bit of a delay while we wait for analytics to run. Depending on our visualization strategy we might be able to break the work up and trade one big delay for a few small delays.
Alternatively, rebuild our annotations preemptively. We might do it as soon as we realize there’s data to analyze, or perhaps we have some kind of schedule or external trigger. The point here is, we run the analysis before we think a user will want to visualize it.
We’ll add these capabilities to our architecture diagram. That means responding to both external data changes as well as internally sourced changes.
Rewinding history
To “rewind and reprocess,” we’ll just delete our annotations and then make sure there’s a mechanism to rebuild them. Here’s an example chain of events we’ll model in our architecture:
Administrative user invalidates some (or all) of the annotations we’ve stored in our cache:
Optionally, if the data was invalidated because source data changed, the system loads fresh data from the external data source.
The system deletes or otherwise invalidates the annotations in our cache.
An event such as “analysis invalidated” (with some metadata, perhaps a date range) is emitted.
The analytics service is listening for events, and receives the “analysis invalidated” event:
The event includes the date range of deleted data. The service checks the date range to see if annotations are missing from the cache.
If the data is still missing, it runs the analysis and rebuilds the missing annotations.
As annotations are rebuilt, they are written to the cache.
An event such as “analysis completed” (with some metadata) is emitted.
Separately, a visualization service might be running where a user asks to display the visualization for some missing data:
The system checks the cache, realizes annotations are still missing, and sends a “run analysis” message directly to the analytics service.
The analytics service is already working on analyzing the data so it can ignore the message, or respond with an “analytics in process” message.
The visualization presents some kind of “waiting for analysis” display while it listens for the “analysis completed” message. When it receives the message, it loads the annotations and displays them.
This is one way to handle a specific chain of events. We’ll need to handle other events and commands as well — such as an event to tell us external data has changed.
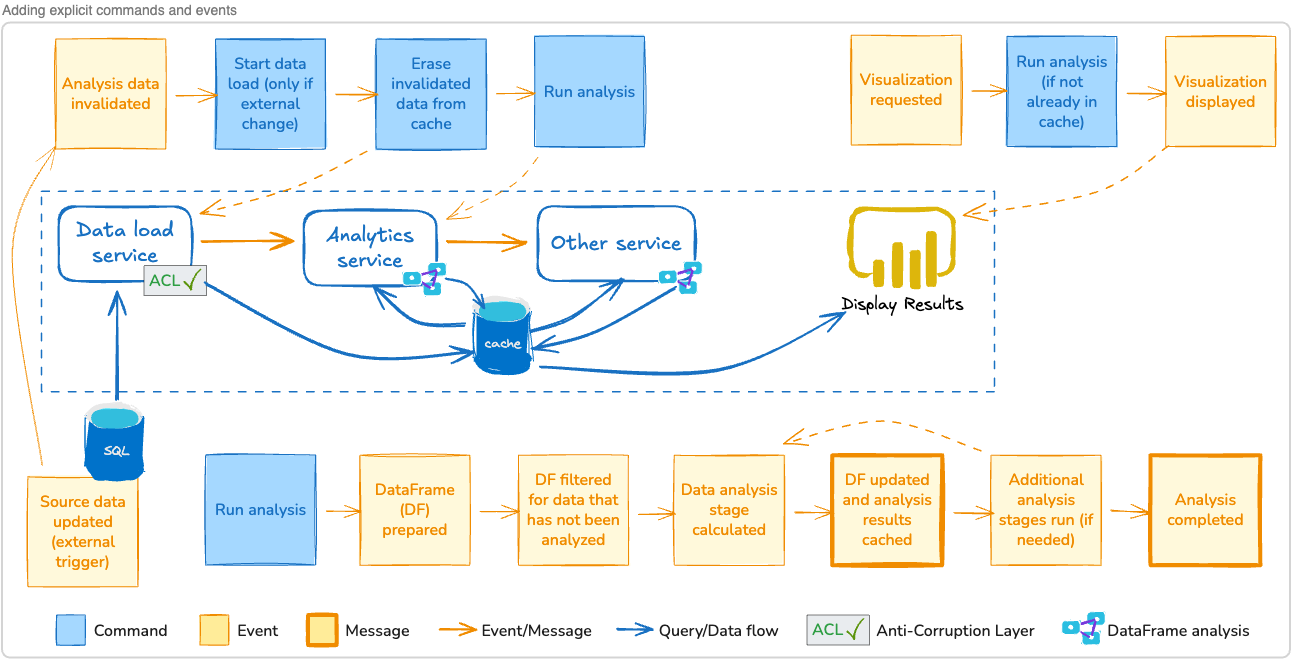
Since we’re talking about responding to events that happen, it makes sense to use event storming to model those events and commands. We can model “things that have happened” (the events) as yellow cards, and “what we want to happen” (the commands) as blue cards.
If you need a refresher, Chapter 2.3 Strategic event storming and Chapter 3.4 Tactical event storming provide in-depth explanations on modeling event driven architectures.
Here’s an updated architectural drawing showing how our events and commands interact with the system:
Can I ask a favor? Do you know someone that would like this article? Please send it to them. Referrals keep this publication alive and growing. (And you’ll earn free access, too).
Persistent annotation cache
One of the things we haven’t decided yet is exactly how we’ll store our annotation data. There are quite a few options, and certainly more than one strategy that will work well.
In part two I hinted at using a relational database to store a copy of the external source data. This makes a lot of sense, but it isn’t the only option.
We could store all of our data in a persistent data store such as MongoDB, a noSQL document-oriented database. Document databases offer some fantastic search capabilities and, perhaps most interesting, don’t force us into a predefined schema — we can, essentially, attach anything as our annotations.
That’s a nifty idea, because we want flexibility to change our data analysis and come up with new data sets to store, freely associating them with source data.
We could also stick with a purely event-driven architecture. In this kind of system, we would emit annotations as events into a persistent queue (such as Kafka). The persistent queue becomes our source of truth — and annotations are just messages on the queue, like, “sprint X: total out-of-sprint hours: 500.”
With many options, it’s probably a good idea to decide on our business requirements:
Obviously, we want to cache the original source data, so we aren’t tightly coupled to an external system. (We know the external system is a relational database).
We want to easily create new annotation data sets. If we dream up a new calculation (maybe, “number of activities completed after hours on Fridays”), we want to be able to store it easily.
We know we’re using DataFrames for analysis. Storing our DataFrames without translating them into something else would be convenient (but not necessary).
Our annotation data should be persistent (to avoid unnecessary delays rerunning an analysis) — but, once a particular report or visualization is no longer being used, we probably don’t need to keep it around.
Finally, we’ll want to think about performance and wait times. We definitely don’t want users to experience a slow system.
The relational cache for source data still makes a lot of sense.
For our internal annotation data, something more flexible is desirable. We don’t want to be constrained by a relational schema, forced to update the schema every time we think up a new report or annotation.
While a noSQL solution seems like a good fit, it may be an unnecessary complication. It would afford long-term persistence, but unless we run into performance problems that long-term persistence may be pointless.
Designing for flexibility makes sense.
We’ll implement our internal annotation cache as a service. The service will:
Allow us to store annotations (data structures) in a persistent fashion (but, not necessarily permanently).
Provide a shared data service (allowing other services to leverage the shared data).
Give us scalability (we can boost processing power or memory, start up multiple copies, or upgrade to a more powerful data store technology).
Allow us to start simple, just storing annotation data in memory. A long-running service might give us all we need (after all, we’d only rebuild our annotations if we restart the server).
Let’s update our architecture diagram one more time:
